IR Information
Print- Trends in business performance
(Consolidated) - Assets Transition
(Consolidated) - Cash Flow Transition
(Consolidated) - Management Index Transition
(Consolidated)
Shareholder's Meeting
NOTICE OF CONVOCATION OF THE 110th ANNUAL GENERAL MEETING OF SHAREHOLDERS
NOTICE OF CONVOCATION OF THE 109th ANNUAL GENERAL MEETING OF SHAREHOLDERS
NOTICE OF CONVOCATION OF THE 108th ANNUAL GENERAL MEETING OF SHAREHOLDERS
Trends in business performance (Consolidated)
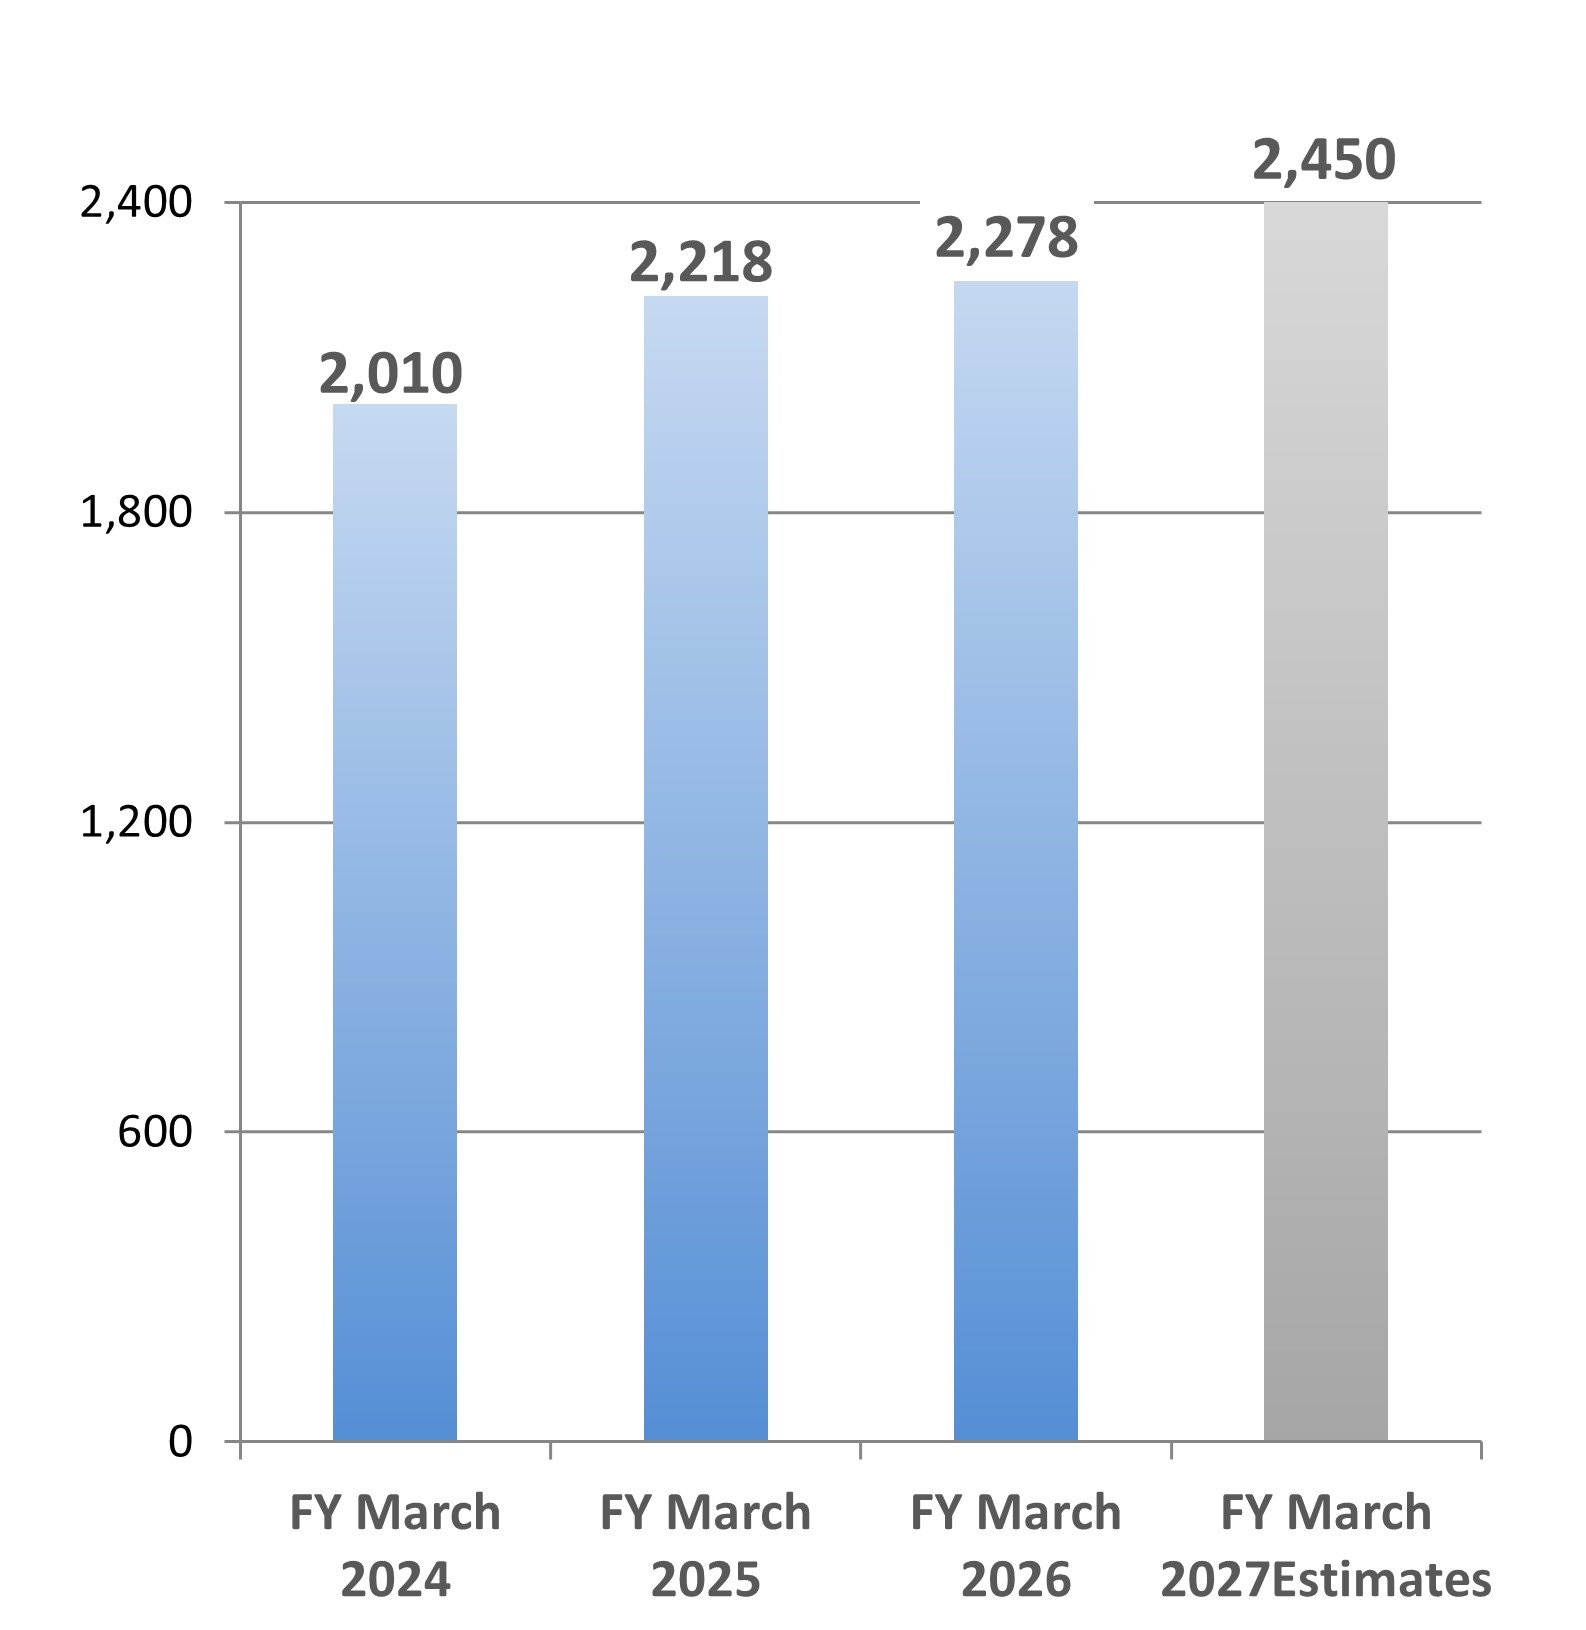
Net sales
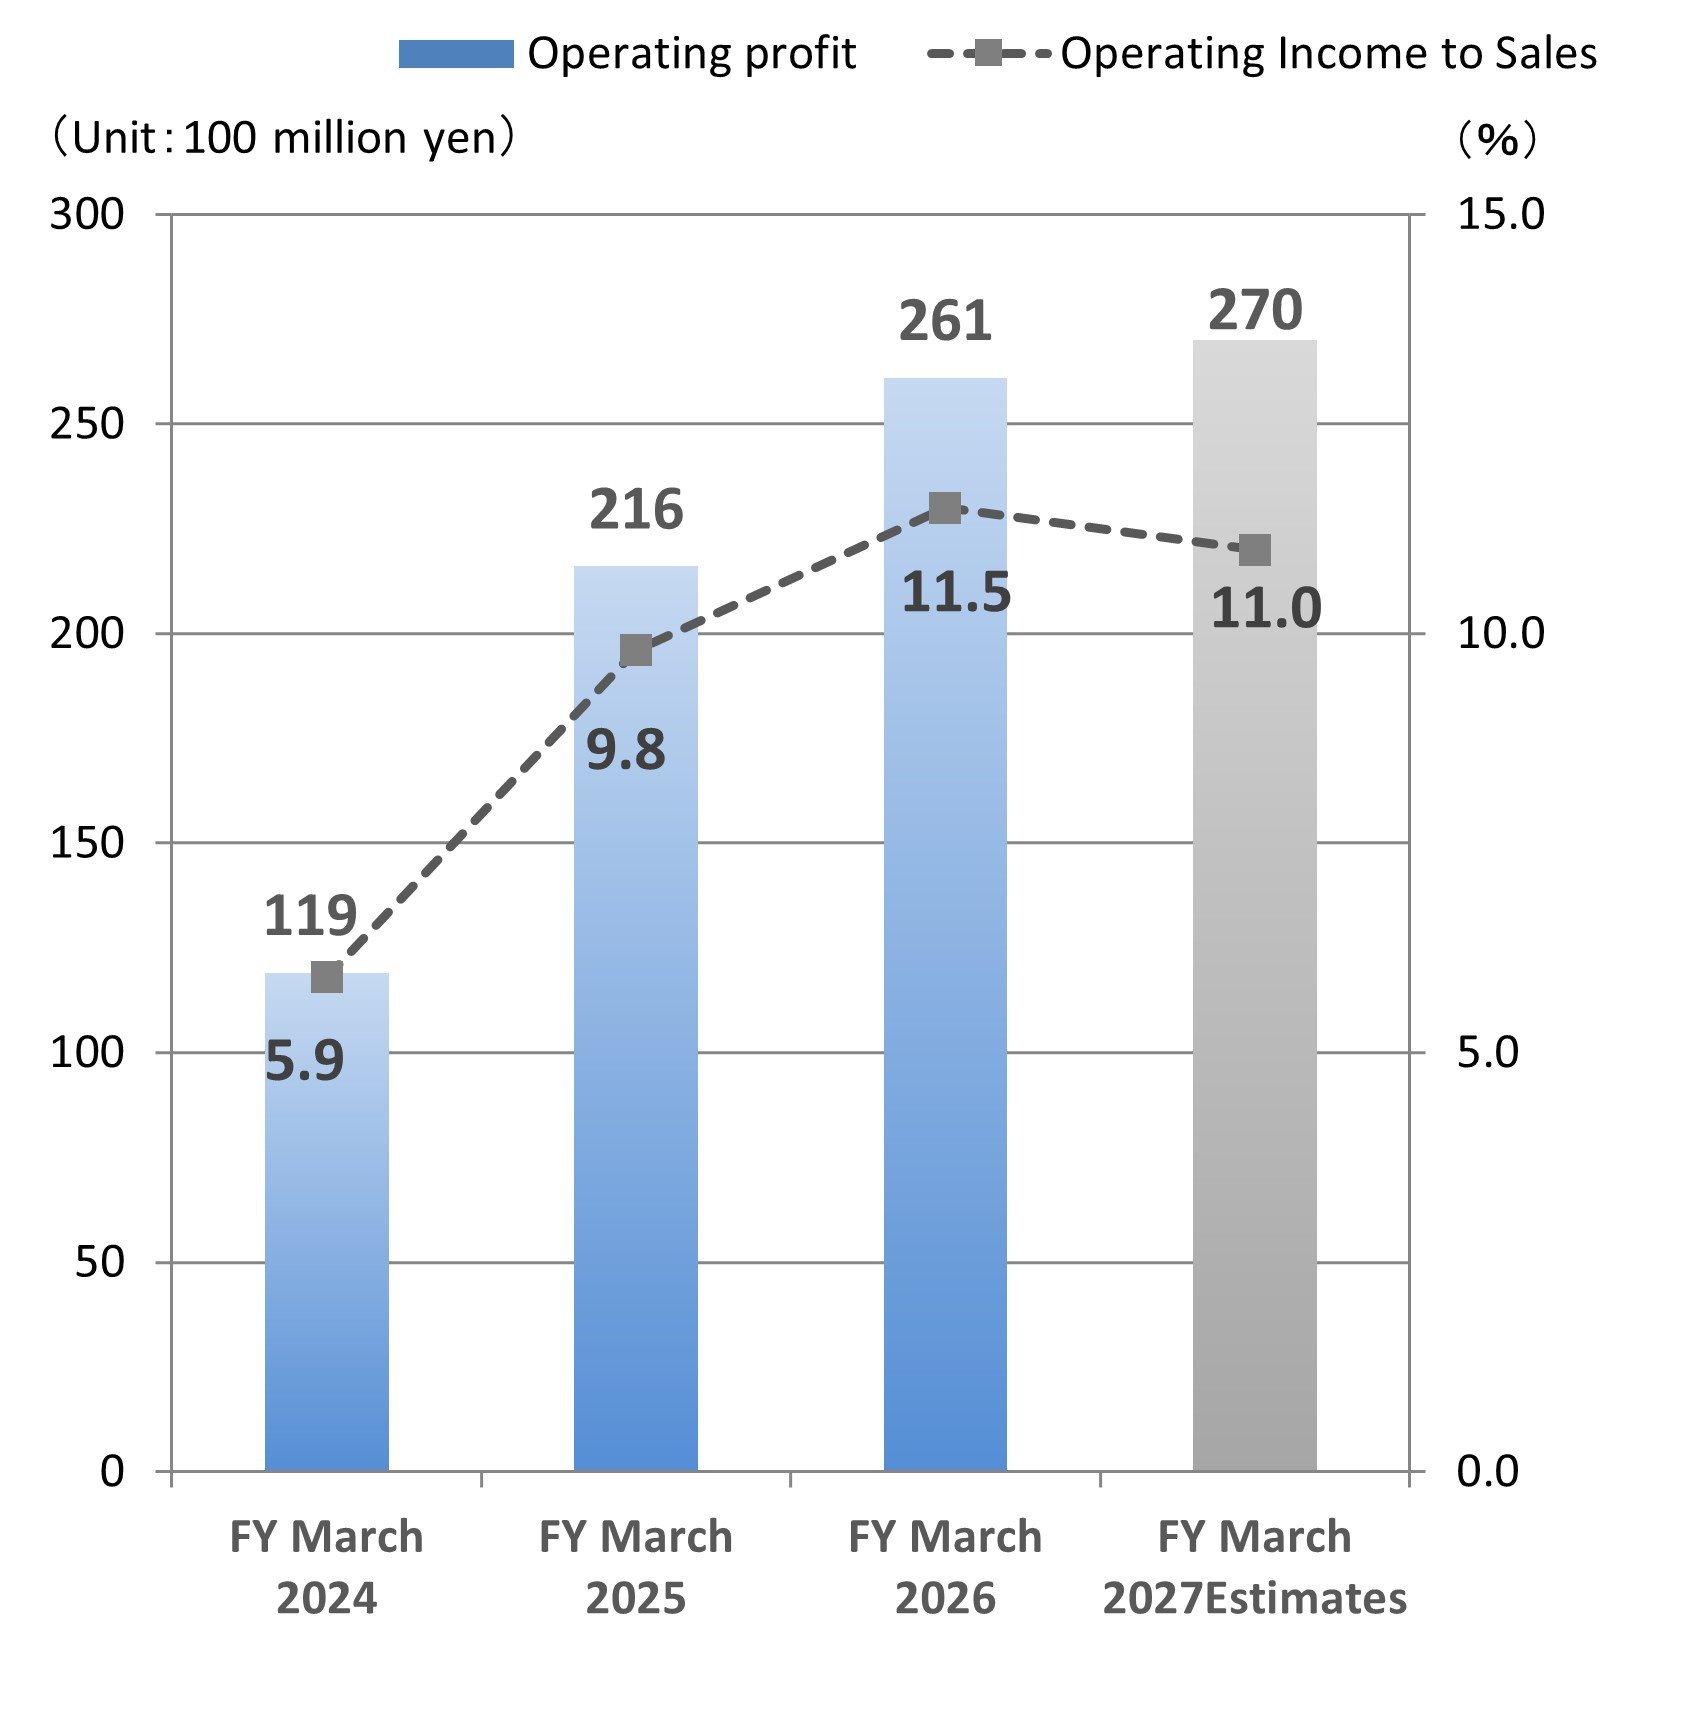
Operating profit/Operating Income to Sales
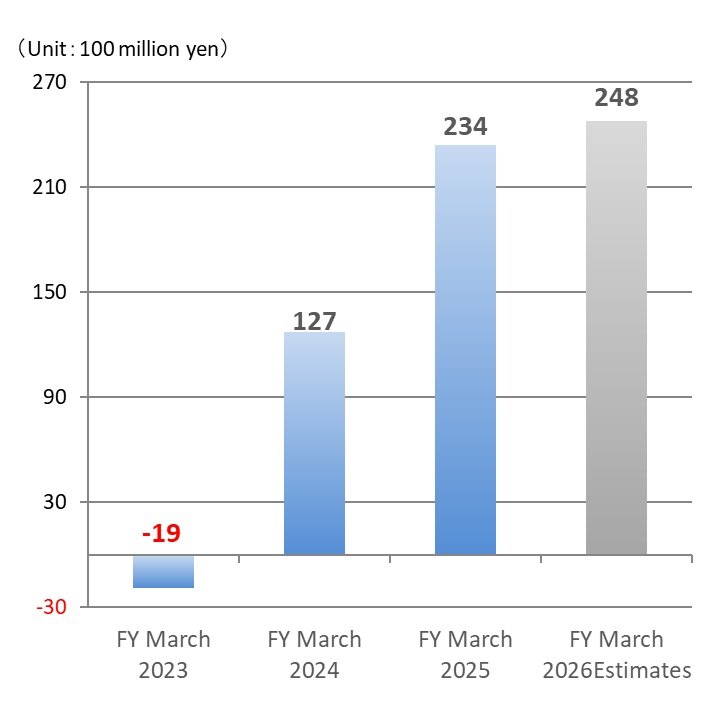
Current Profit
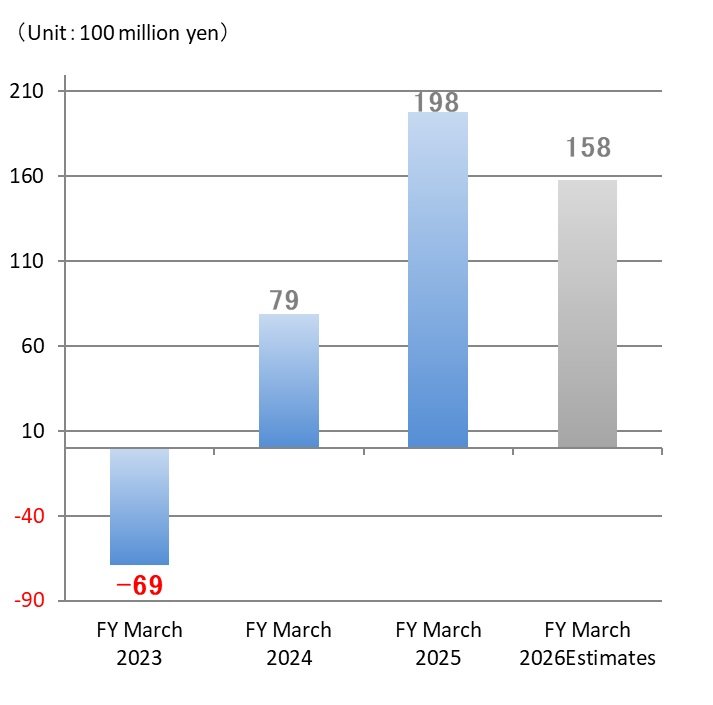
Profit attributable to owners of parent
2023年度 FY March 2024 |
2024年度 FY March 2025 |
2025年度 FY March 2026 |
2026年度予想 FY March 2027 Estimates |
|
|---|---|---|---|---|
売上高 Net sales |
2,010 | 2,218 | 2,278 | 2,450 |
営業利益 Operating profit |
119 | 216 | 261 | 270 |
営業利益率(%) Operating Income to Sales (%) |
5.9 | 9.8 | 11.5 | 11.0 |
経常利益 Current Profit |
127 | 234 | 274 | 295 |
親会社株主に帰属する当期純利益 Profit attributable to owners of parent |
79 | 198 | 184 | 197 |
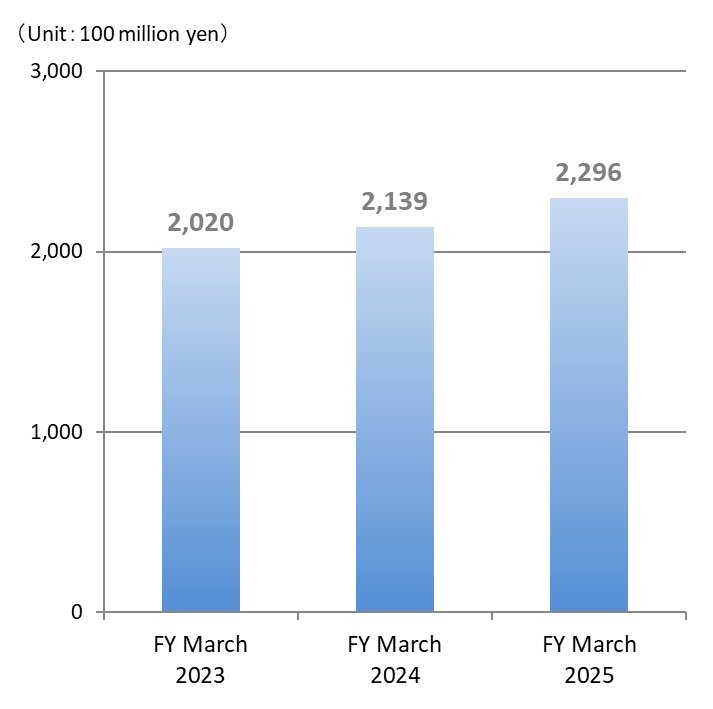
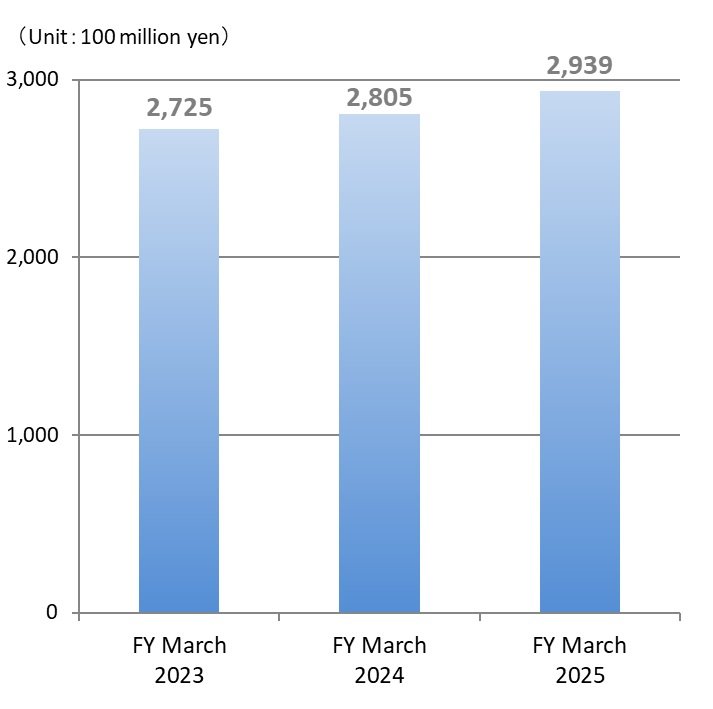
Assets Transition (Consolidated)
Net assets
Total assets
2023年度 FY March 2024 |
2024年度 FY March 2025 |
2025年度 FY March 2026 |
|
|---|---|---|---|
純資産 Net assets |
2,139 | 2,296 | 2,478 |
総資産 Total assets |
2,805 | 2,939 | 3,178 |
Cash Flow Transition (Consolidated)
2023年度 FY March 2024 |
2024年度 FY March 2025 |
2025年度 FY March 2026 |
|
|---|---|---|---|
営業活動によるキャッシュ・フロー Cash flows from operating activities |
13,721 | 22,754 | 29,146 |
投資活動によるキャッシュ・フロー Cash flows from investing activities |
△6,098 | △11,525 | △7,086 |
財務活動によるキャッシュ・フロー Cash flows from financing activities |
△7,316 | △7,643 | △12,993 |
Management Index Transition (Consolidated)
2023年度 FY March 2024 |
2024年度 FY March 2025 |
2025年度 FY March 2026 |
|
|---|---|---|---|
1株当たり当期純利益(EPS)(円) Basic earnings per share(Yen) |
145.37 | 366.88 | 341.97 |
1株当たり純資産額(BPS)(円) Net assets per share(Yen) |
3,893.07 | 4,183.81 | 4,613.43 |
1株当たり配当金(円) Dividends per share(Yen) |
104 | 120 | 135 |
自己資本比率(%) Capital-to-asset ratio(%) |
75.2 | 77.1 | 76.9 |
自己資本当期純利益率(ROE)(%) Return on equity(%) |
3.9 | 9.1 | 7.9 |
総資産当期純利益率(ROA)(%) Return on asset(%) |
2.9 | 6.9 | 6.0 |
株価収益率(PER)(倍) Price-earnings ratio(times) |
21.08 | 8.98 | 13.33 |
株価純資産倍率(PBR)(倍) Price-book value ratio(times) |
0.79 | 0.79 | 0.99 |